01
Introduction to Experiments
Hypotheses, independent and dependent variables, operationalisation, experimental designs, controls and quasi-experiments are developed through the Dual Coding demonstration and Rosenthal and Jacobson study.
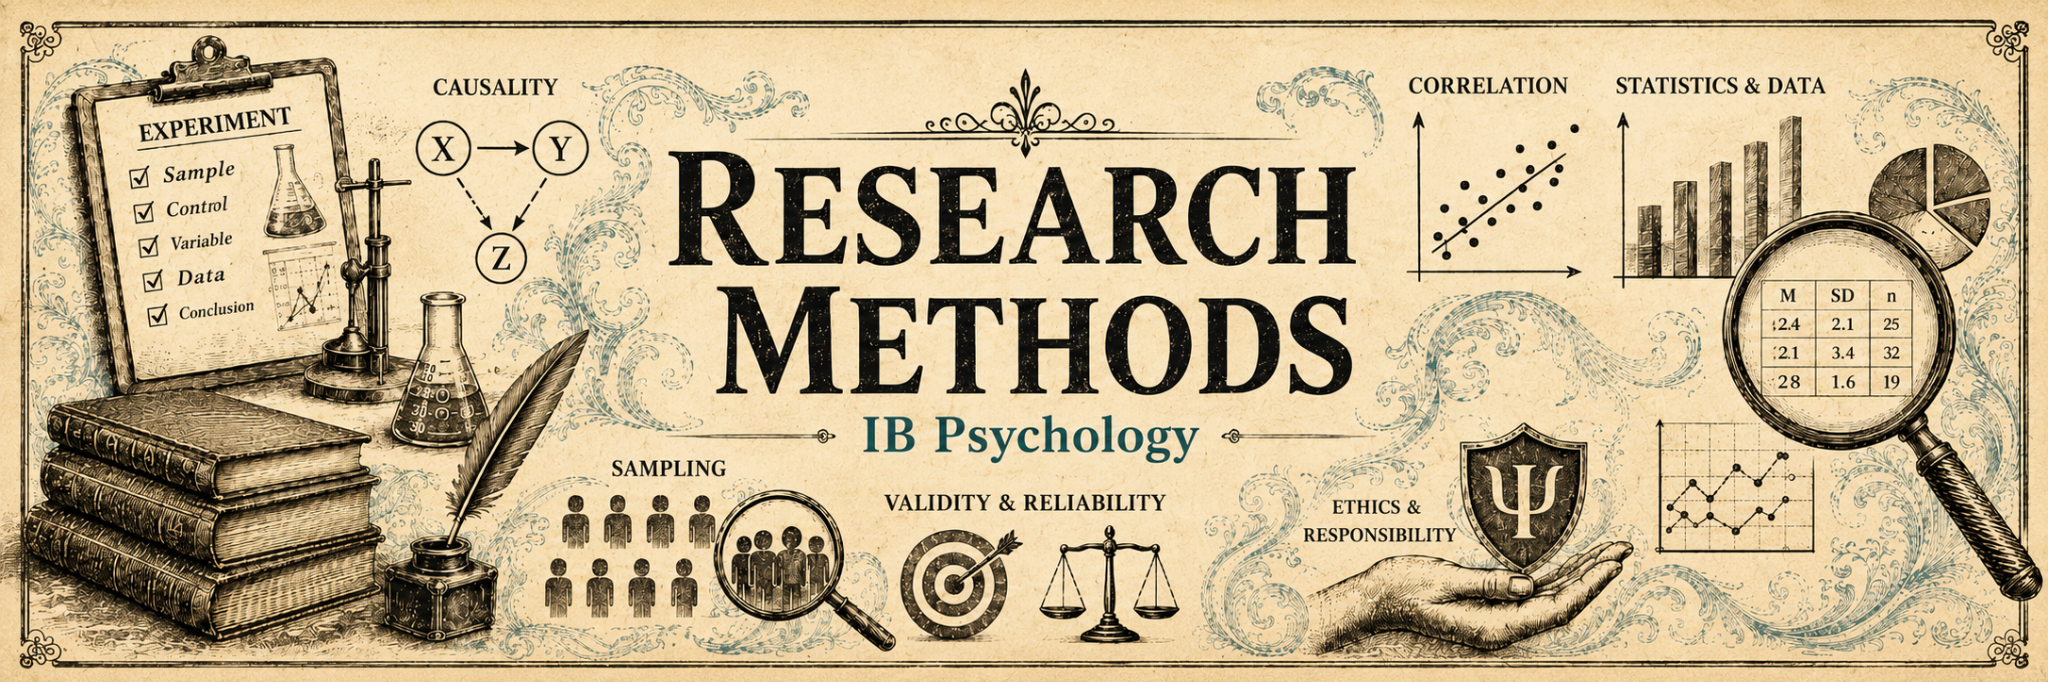
Research methodology is the connective tissue of the programme. Students first learn how experiments are designed, sampled, evaluated and conducted responsibly, then apply perspectives to the claims psychologists make. The data-analysis sequence develops correlation, data classification, representation, descriptive statistics, reliability and validity so students can interpret evidence with appropriate caution across all four contexts.
Topics 1–5 establish the core methodology sequence. Topics 6.1–6.5 extend data-analysis understanding for all students and are assessed directly in the HL examination.
Hypotheses, independent and dependent variables, operationalisation, experimental designs, controls and quasi-experiments are developed through the Dual Coding demonstration and Rosenthal and Jacobson study.
Target populations, self-selected, opportunity, random and stratified sampling are compared through scenarios that connect representativeness, bias and responsible generalisation.
Internal, external, construct, ecological and population validity are examined alongside confounds, demand characteristics, expectancy effects, placebo effects, social desirability and carryover effects.
Consent and assent, anonymity, withdrawal, deception, protection from undue stress or harm and debriefing are applied to proposals, historical examples and a mock ethics-board review.
Reductionism and holism, biological and environmental determinism, cultural relativism, free will and responsibility are used to compare explanations and judgments.
Direction and strength are read from scatterplots while students distinguish correlation from causation and consider bidirectional, third-variable and spurious relationships.
Students classify levels and forms of data, sources of evidence and study designs before separating what was predicted, what was observed and what can reasonably be inferred.
Line graphs, bar charts, histograms and box plots are selected and critiqued in relation to data type, research purpose, visual clarity and misleading presentation.
Mean, median, standard deviation, quartiles, box plots and statistical significance are interpreted to understand patterns and variation; examination emphasis is on interpretation rather than calculation.
Inter-rater, test-retest and procedural reliability are evaluated alongside internal, construct, ecological and population validity through applied research scenarios.
Students identify hypotheses, variables, designs, controls and confounds, then judge when an experimental conclusion can—and cannot—support causation.
Students compare sampling techniques, identify selection bias and connect representativeness to the population to which findings may responsibly apply.
Students diagnose threats to measurement and procedure, distinguish forms of validity and reliability, and recommend justified improvements.
Students apply ethical principles to realistic proposals and defend decisions that balance scientific value, participant welfare and responsible communication.
Students examine how reductionism, determinism, culture, free will and responsibility shape explanations and interpretations of behaviour.
Students read data displays and descriptive statistics, separate observation from inference, evaluate claims and communicate evidence with appropriate caution.
Research methodology supports the four course contexts; it is not a fifth context. Formal Class Practicals are completed within those contexts rather than inside this Research unit.
Research terminology and concepts such as bias, causality, measurement and responsibility support evidence-based responses across the four contexts.
This unit supplies the methodological foundation students use when discussing their four context-based Class Practicals and evaluating an unseen study.
The 6.1–6.5 sequence directly prepares students to interpret correlations, data types, graphs, descriptive statistics, reliability, validity, transferability and source evidence.
These are the activities taught in the uploaded Research sequence. The Dual Coding and Stroop tasks are classroom demonstrations, not formal Class Practicals.
Students compare words presented with and without images, calculate group means, identify the hypothesis and variables, and analyse Rosenthal and Jacobson’s experiment.
Eight applied scenarios and a mindfulness-and-sport study require students to select sampling techniques and evaluate representativeness, bias and generalisability.
Students diagnose flaws in stereotype, mathematics, vocabulary and competition studies, then distinguish extraneous variables from threats to valid conclusions.
Historical cases, eight proposed studies and a self-esteem manipulation prompt are used to apply ethical principles and justify responsible research decisions.
Kenneth Parks, applied scenarios and the Daniel R. profile are interpreted through reductionism, holism, determinism, culture, free will and responsibility.
Students plot and interpret relationships, critique causal claims and examine the relationship between income and happiness for alternative explanations and bias.
Sleep, school and mindfulness examples develop accurate classification of data and evidence while separating observations from defensible inferences.
Students select line, bar, histogram or box-plot representations, identify limitations and propose improvements using Paper 3-style prompts.
A Stroop-style comparison is used to calculate for understanding, graph results and interpret mean, median, spread, quartiles and statistical significance.
Marriage communication, oxytocin and trust, free-throw visualisation, and stress-and-attention studies are evaluated for reliability and validity.
Students complete the supplied culture-and-relationships source paper to integrate data interpretation, methodological evaluation and evidence-based communication.